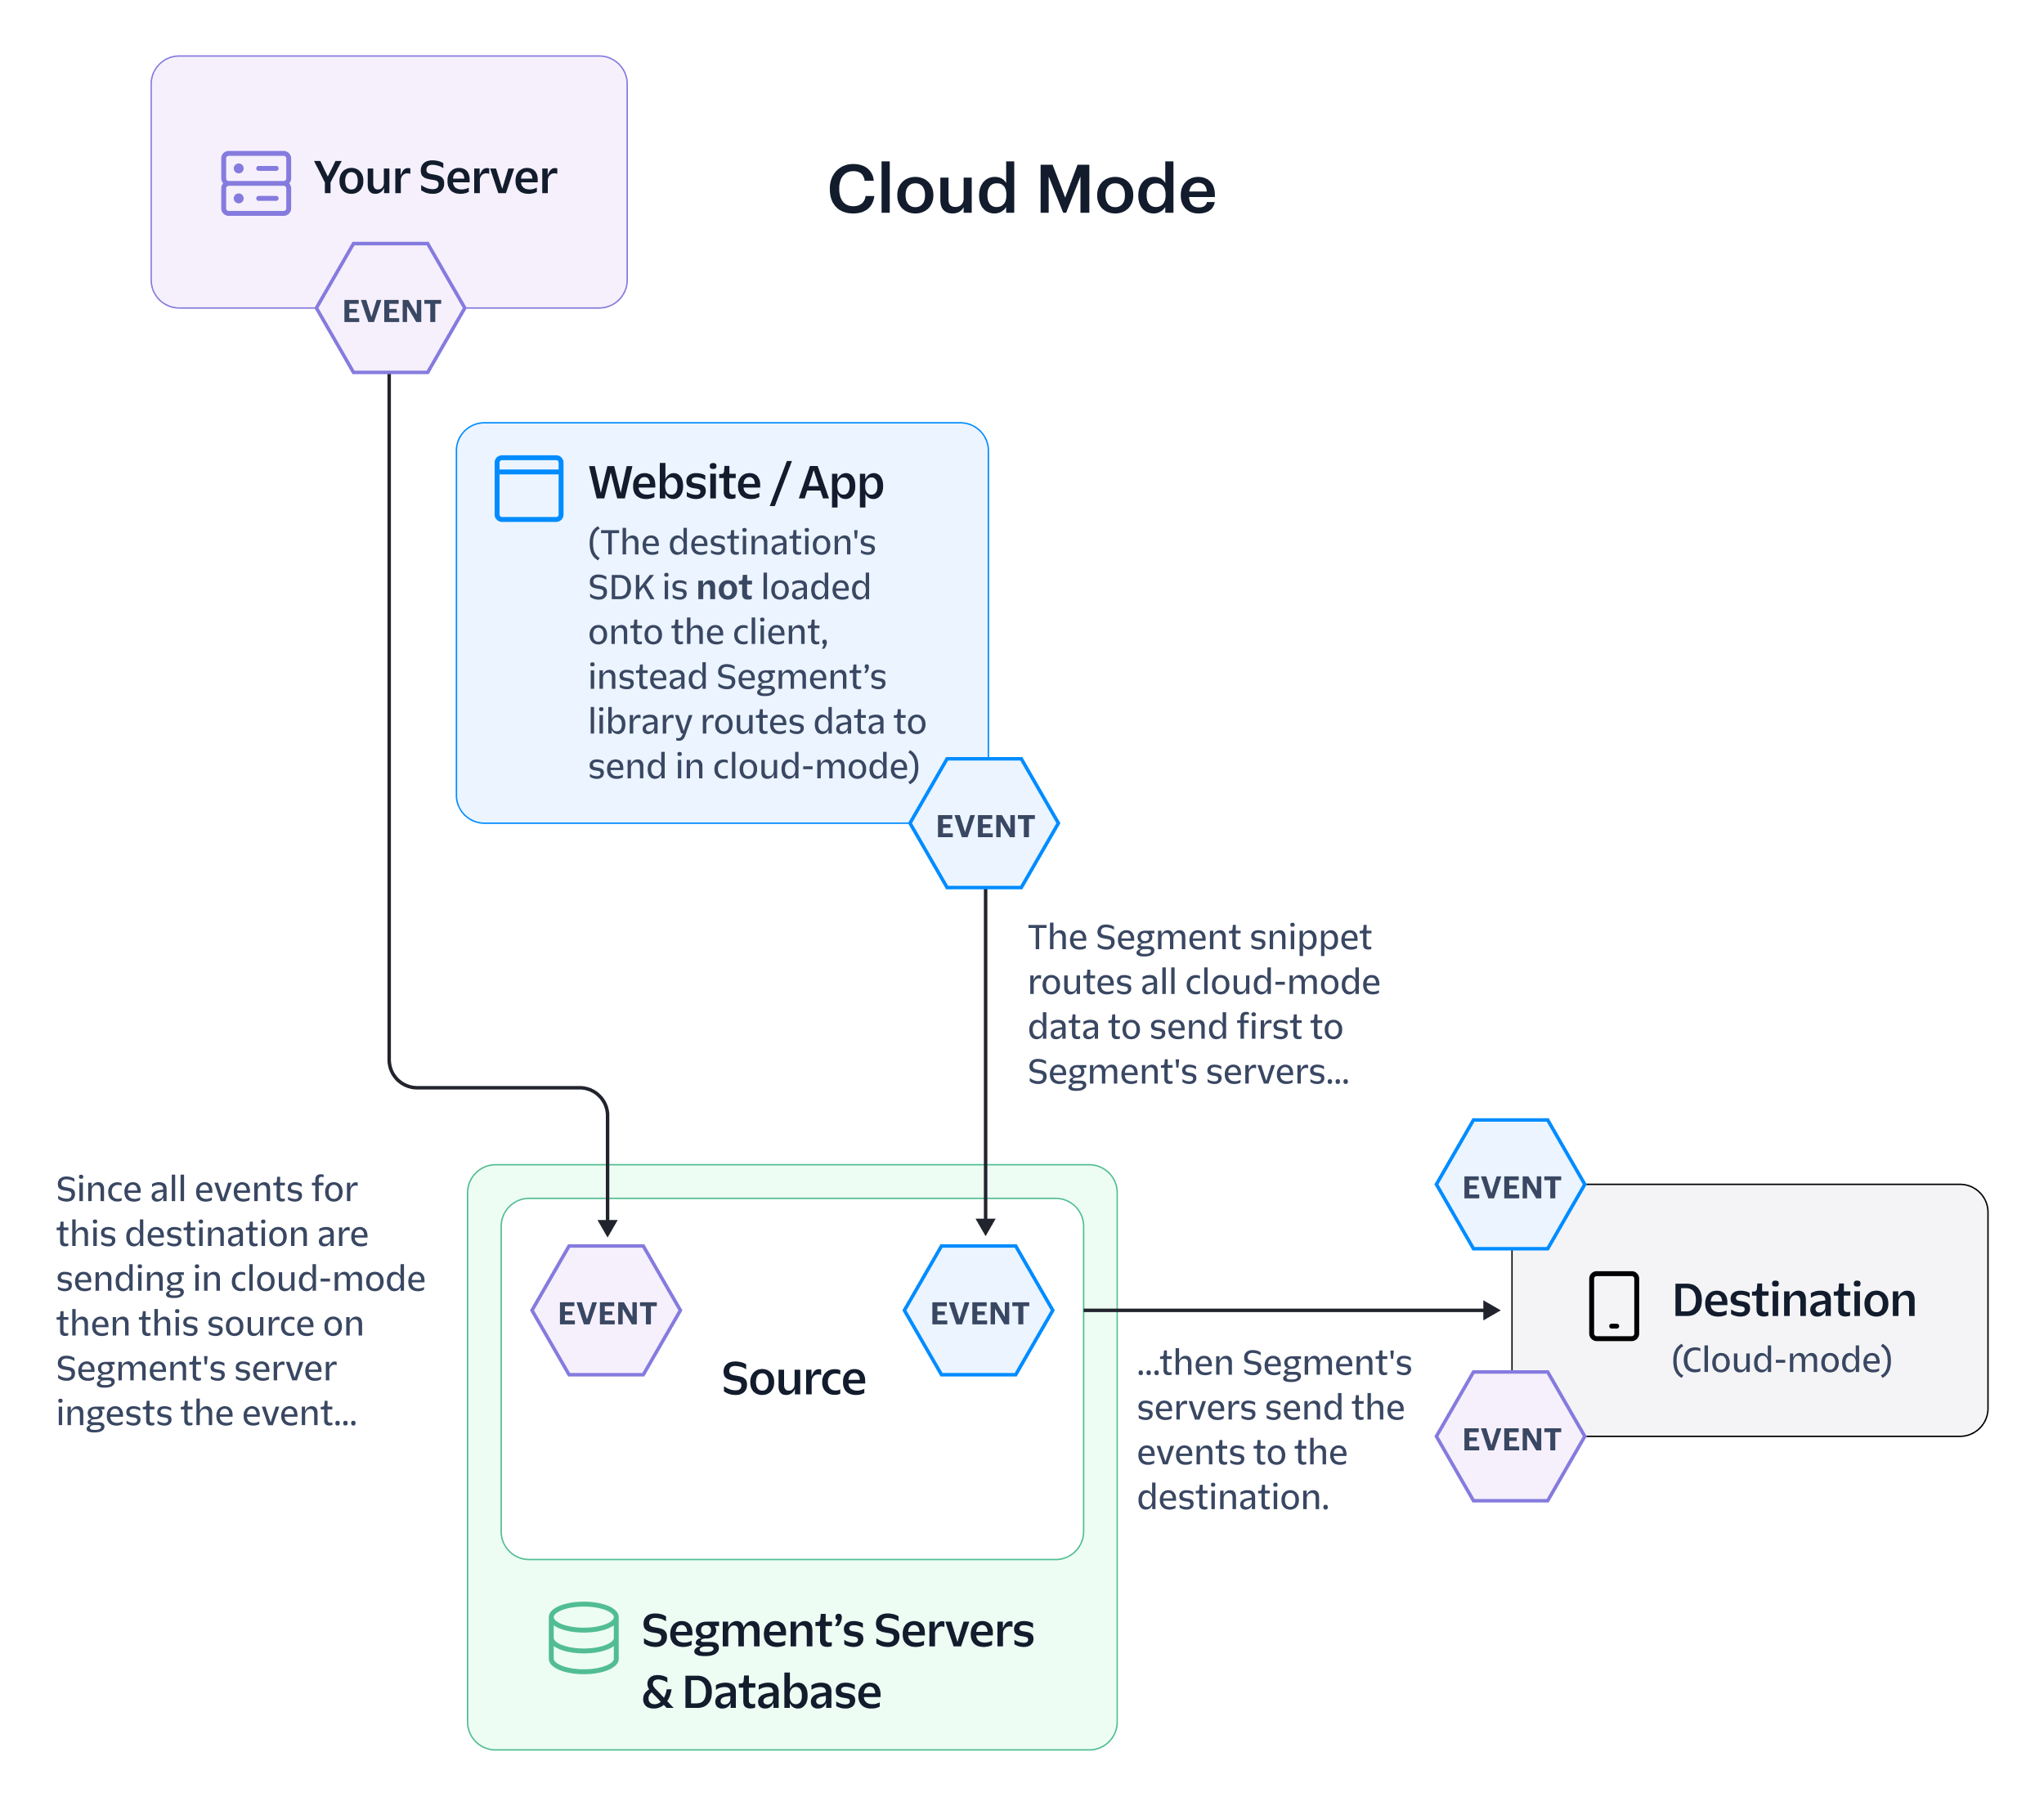
Cloud/Device Data Flow Diagrams
These diagrams depict Twilio’s Segment Customer Data Platform, a service that simplifies collecting and using data from the users of digital properties such as websites, apps, etc. The illustrated flows of Cloud and Device modes were incorporated into documentation referenced by engineers and developers.

Brief: Create diagrams to depict Twilio’s Segment Customer Data Platform, a service that simplifies collecting and using data from the users of digital properties such as websites, apps, etc.
Challenge: Identify respective data flows and determine how best to display this abstract process visually.
Solution: I worked with a product manager and developer to document the data flows and then iterated to find the most efficient way to display the flows.
Result: The illustrated flows of Cloud and Device modes were incorporated into documentation referenced by engineers and developers.
Programs: Figma