Cycles of Harmful Help Infographics
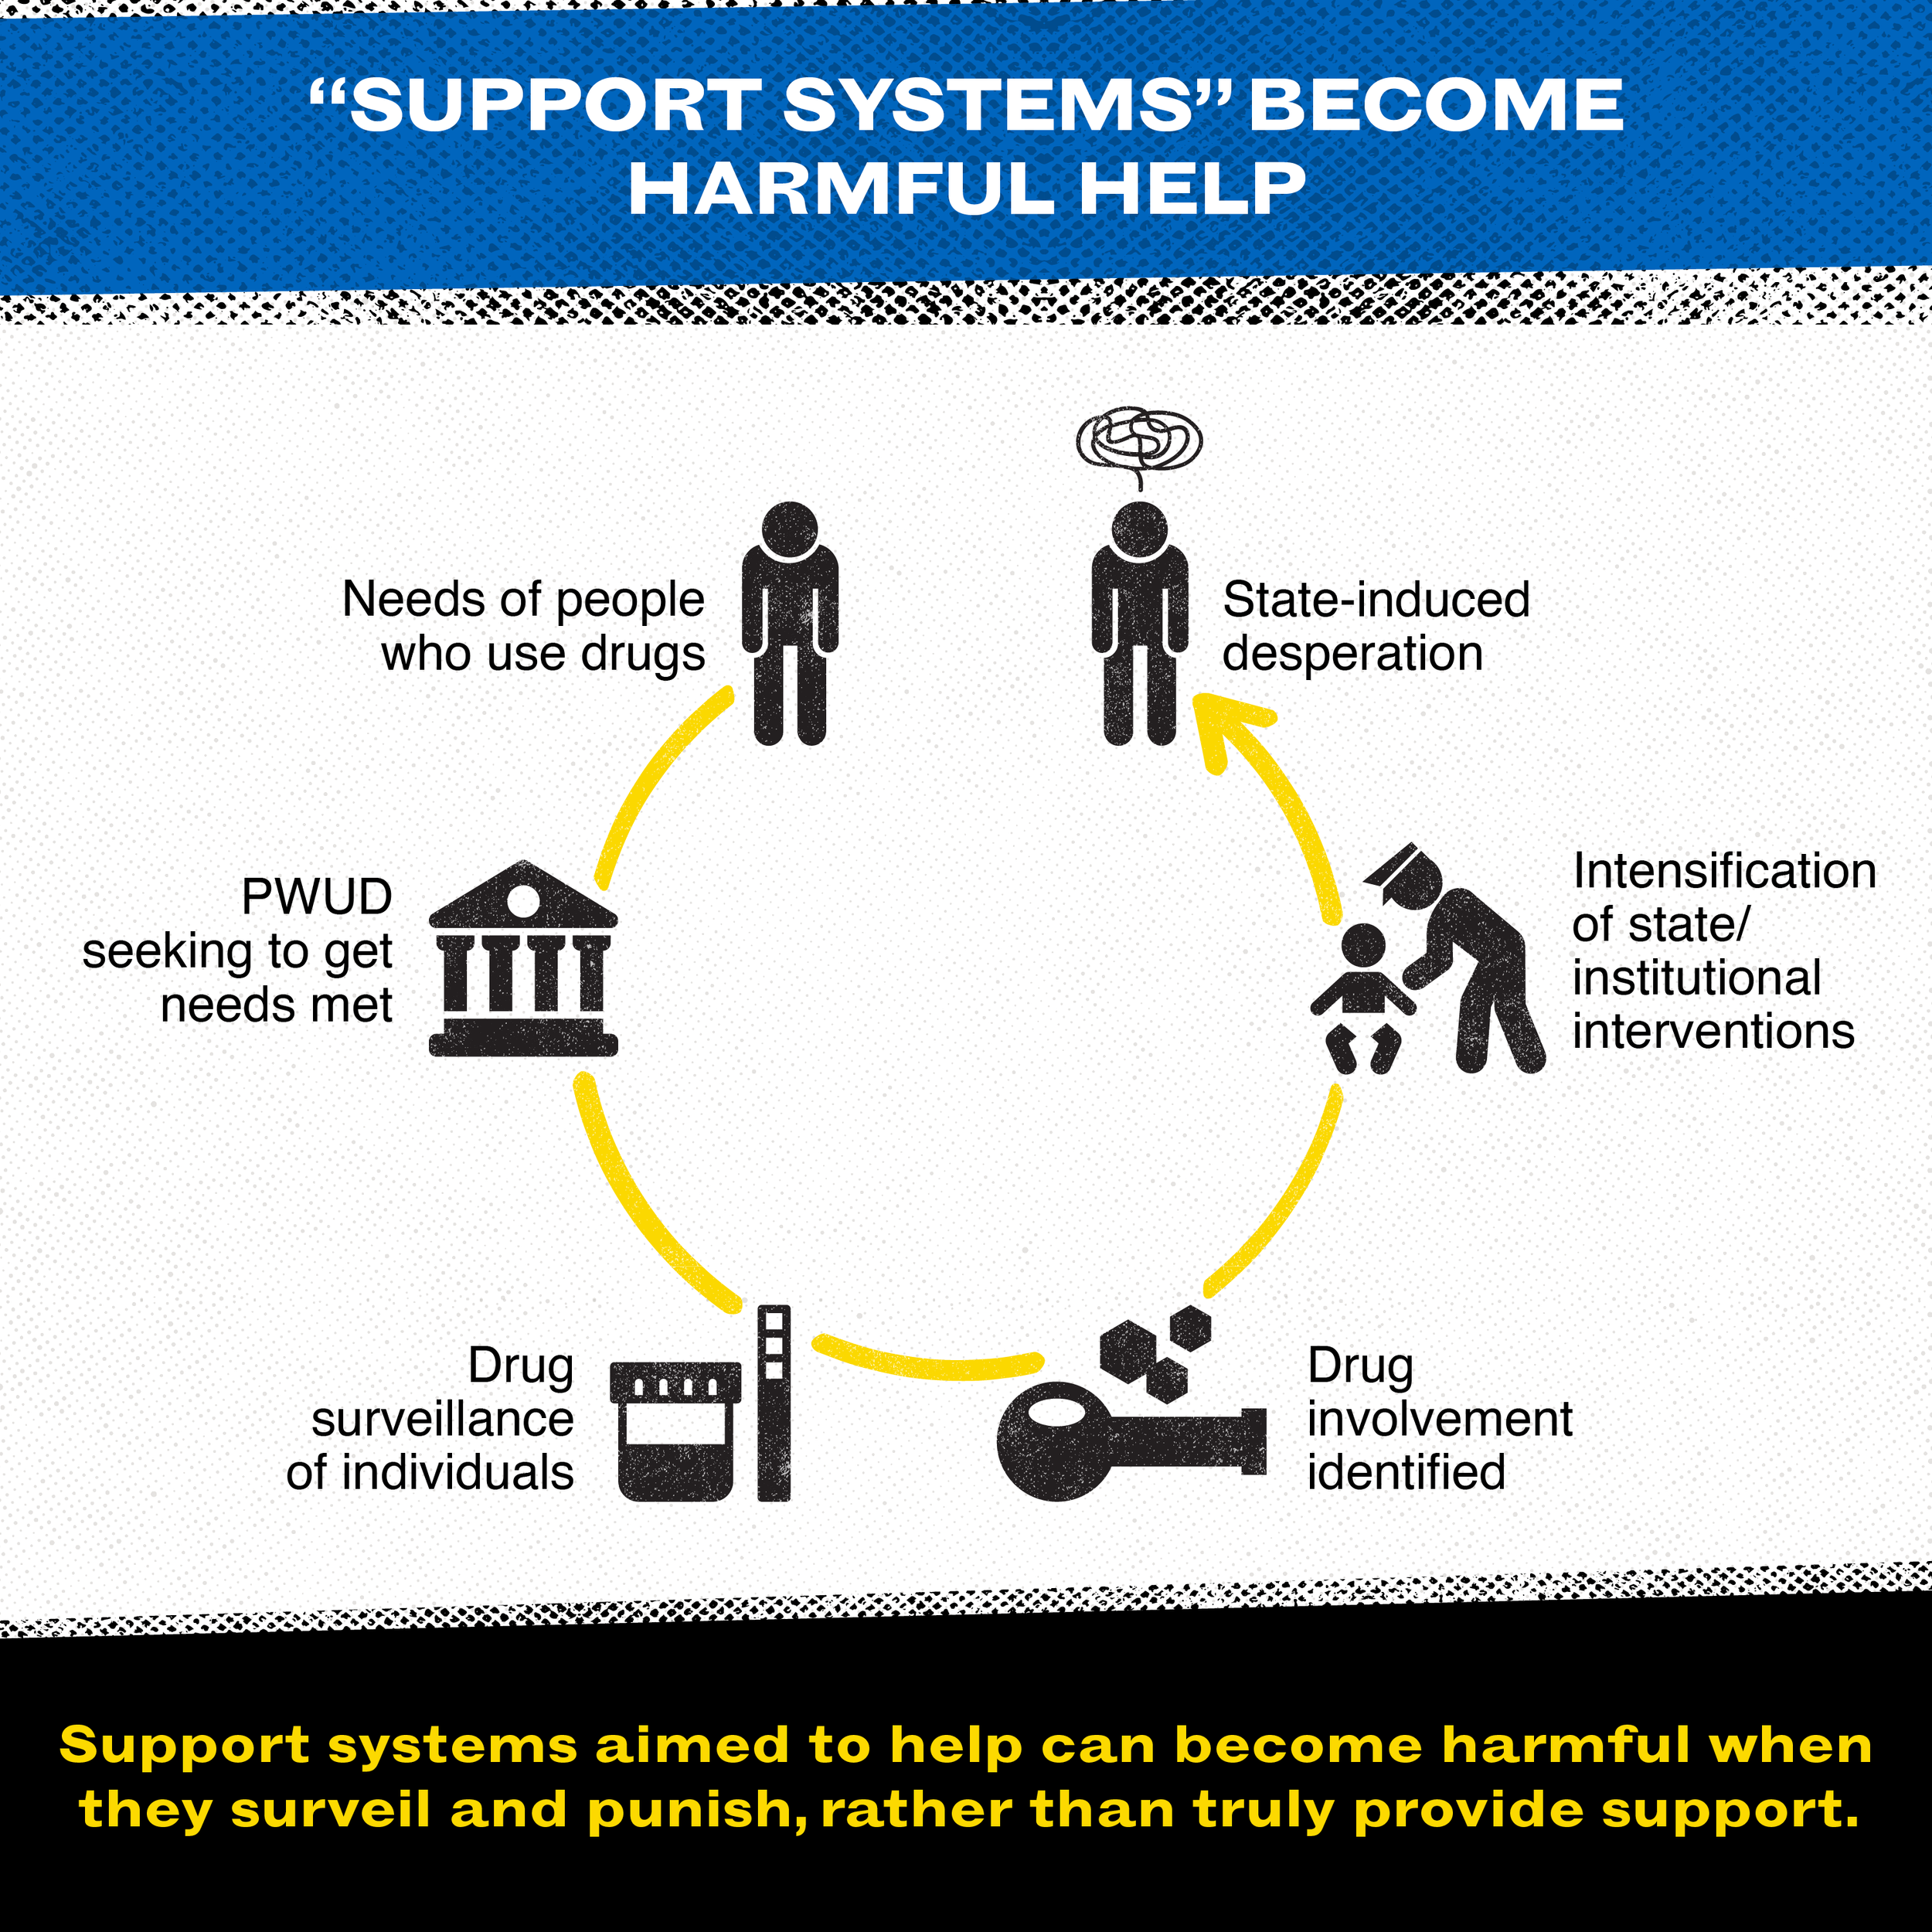
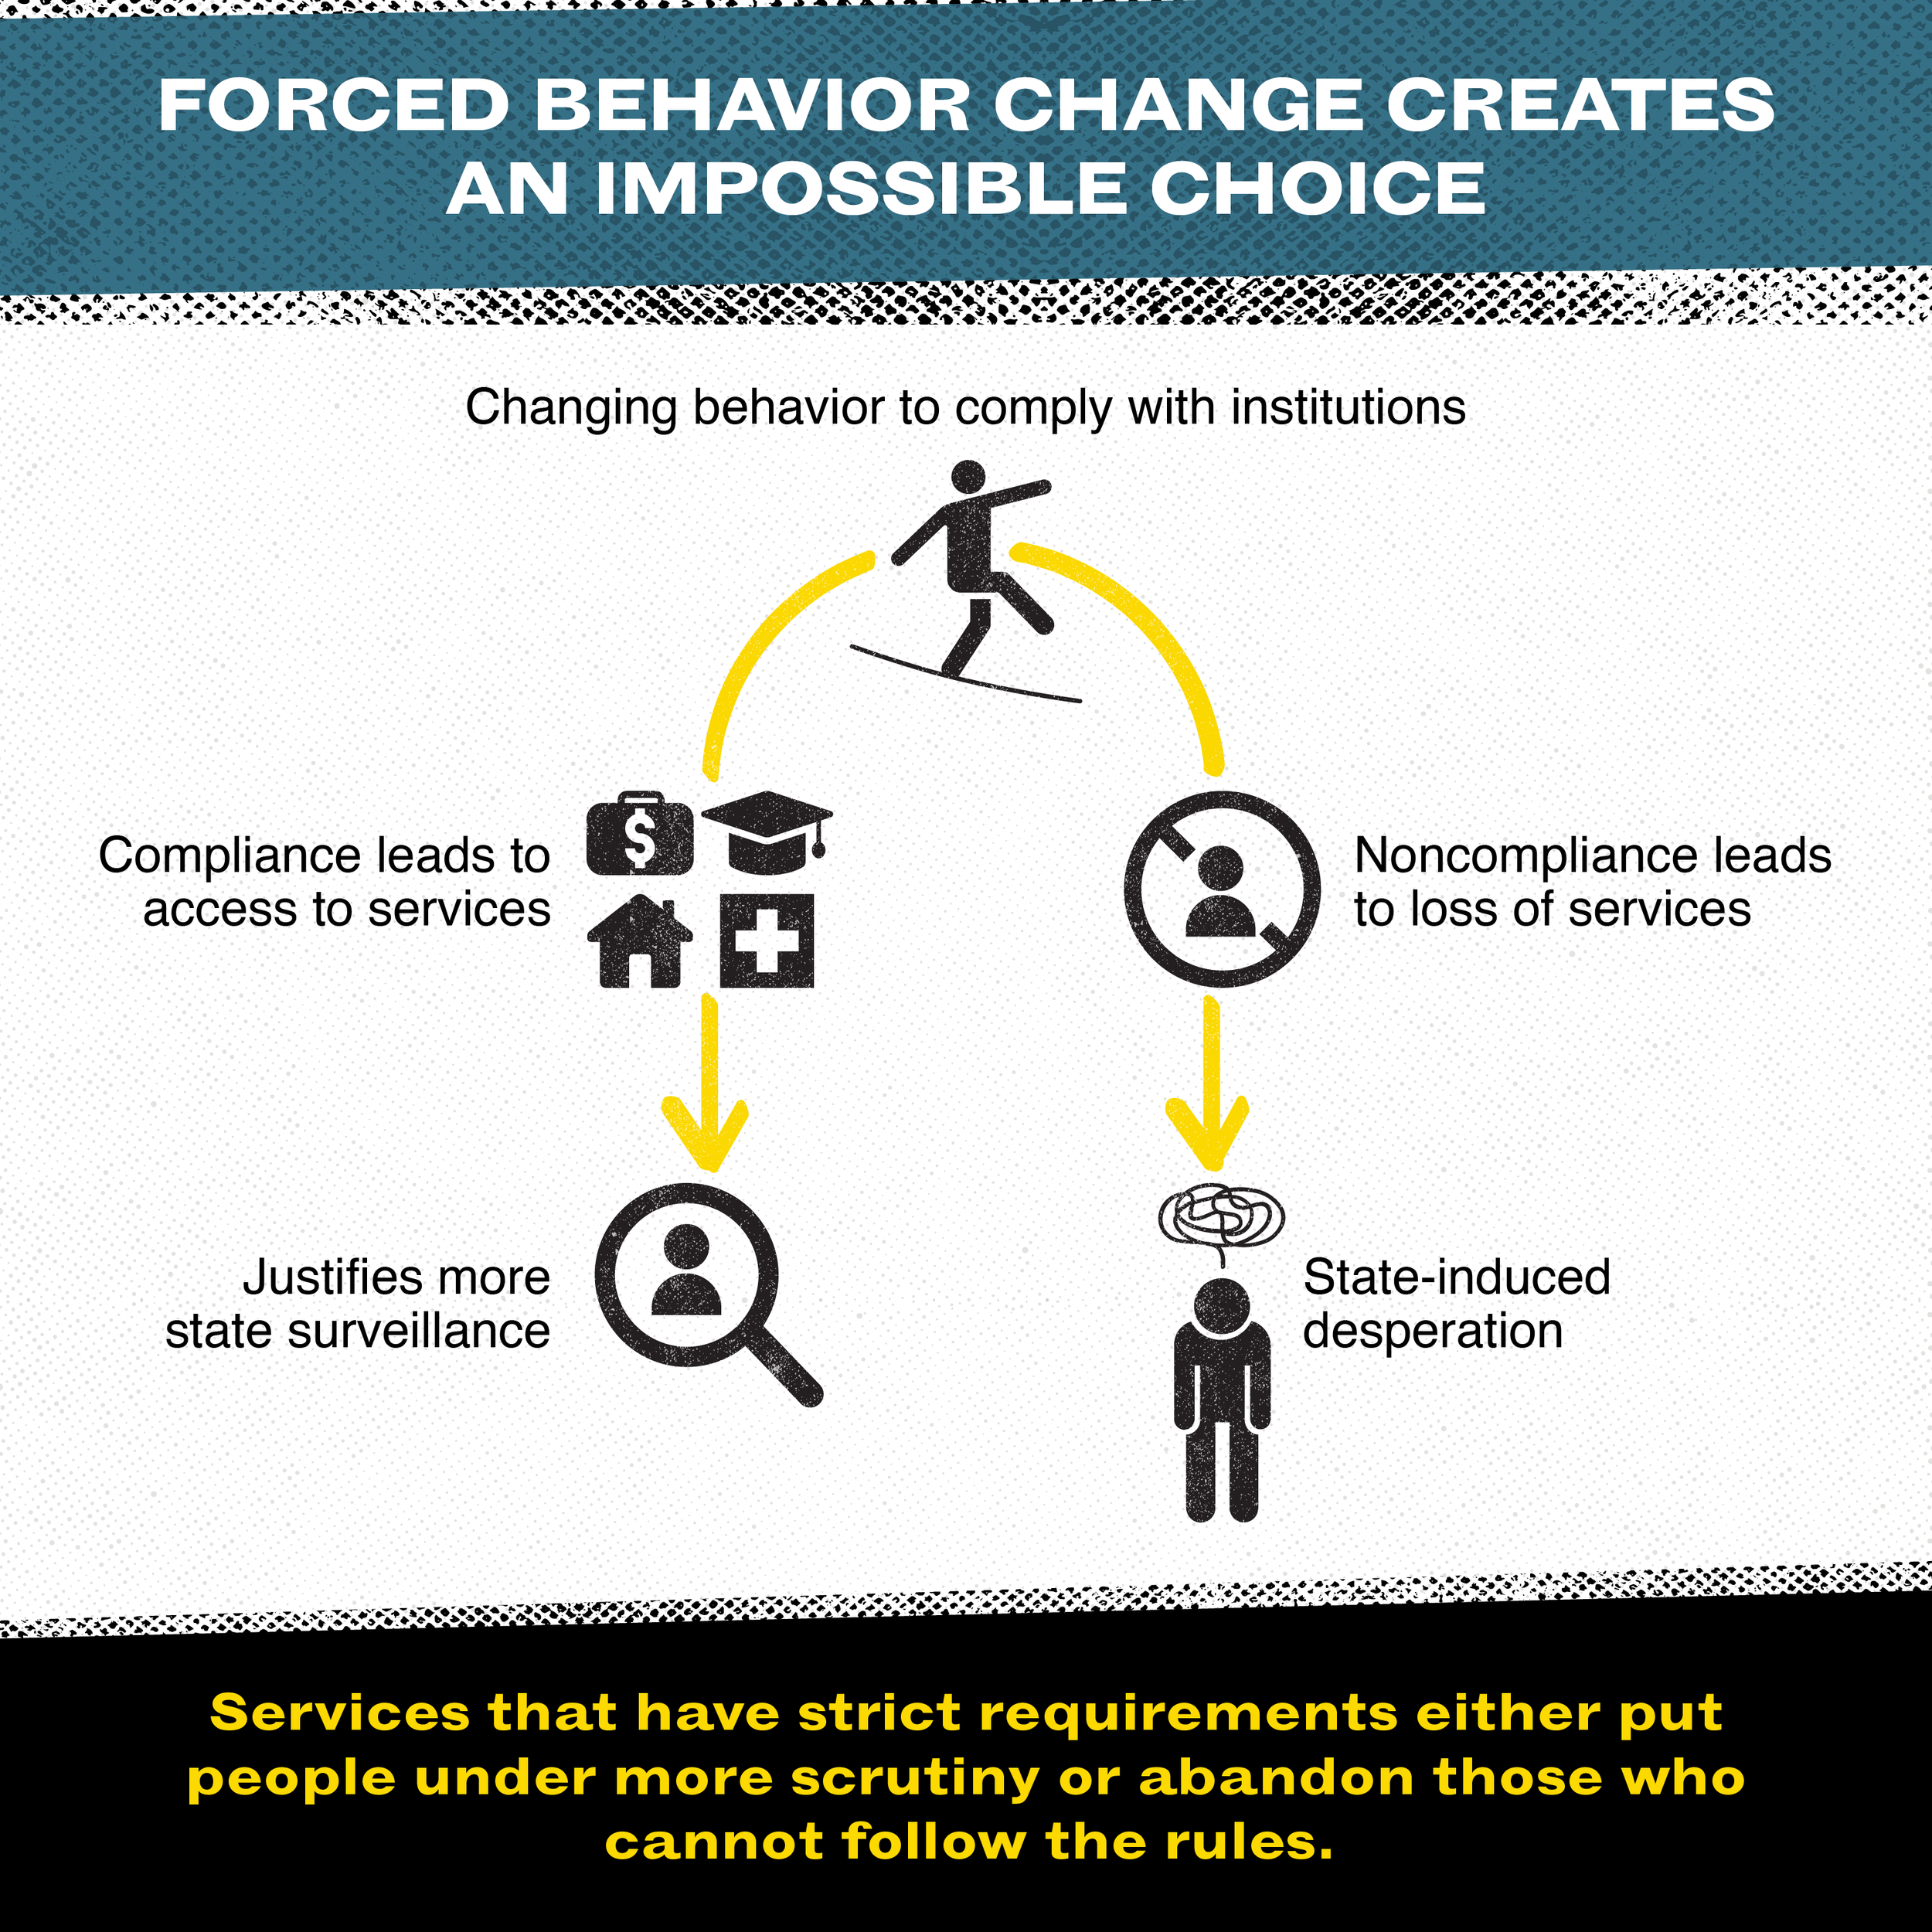
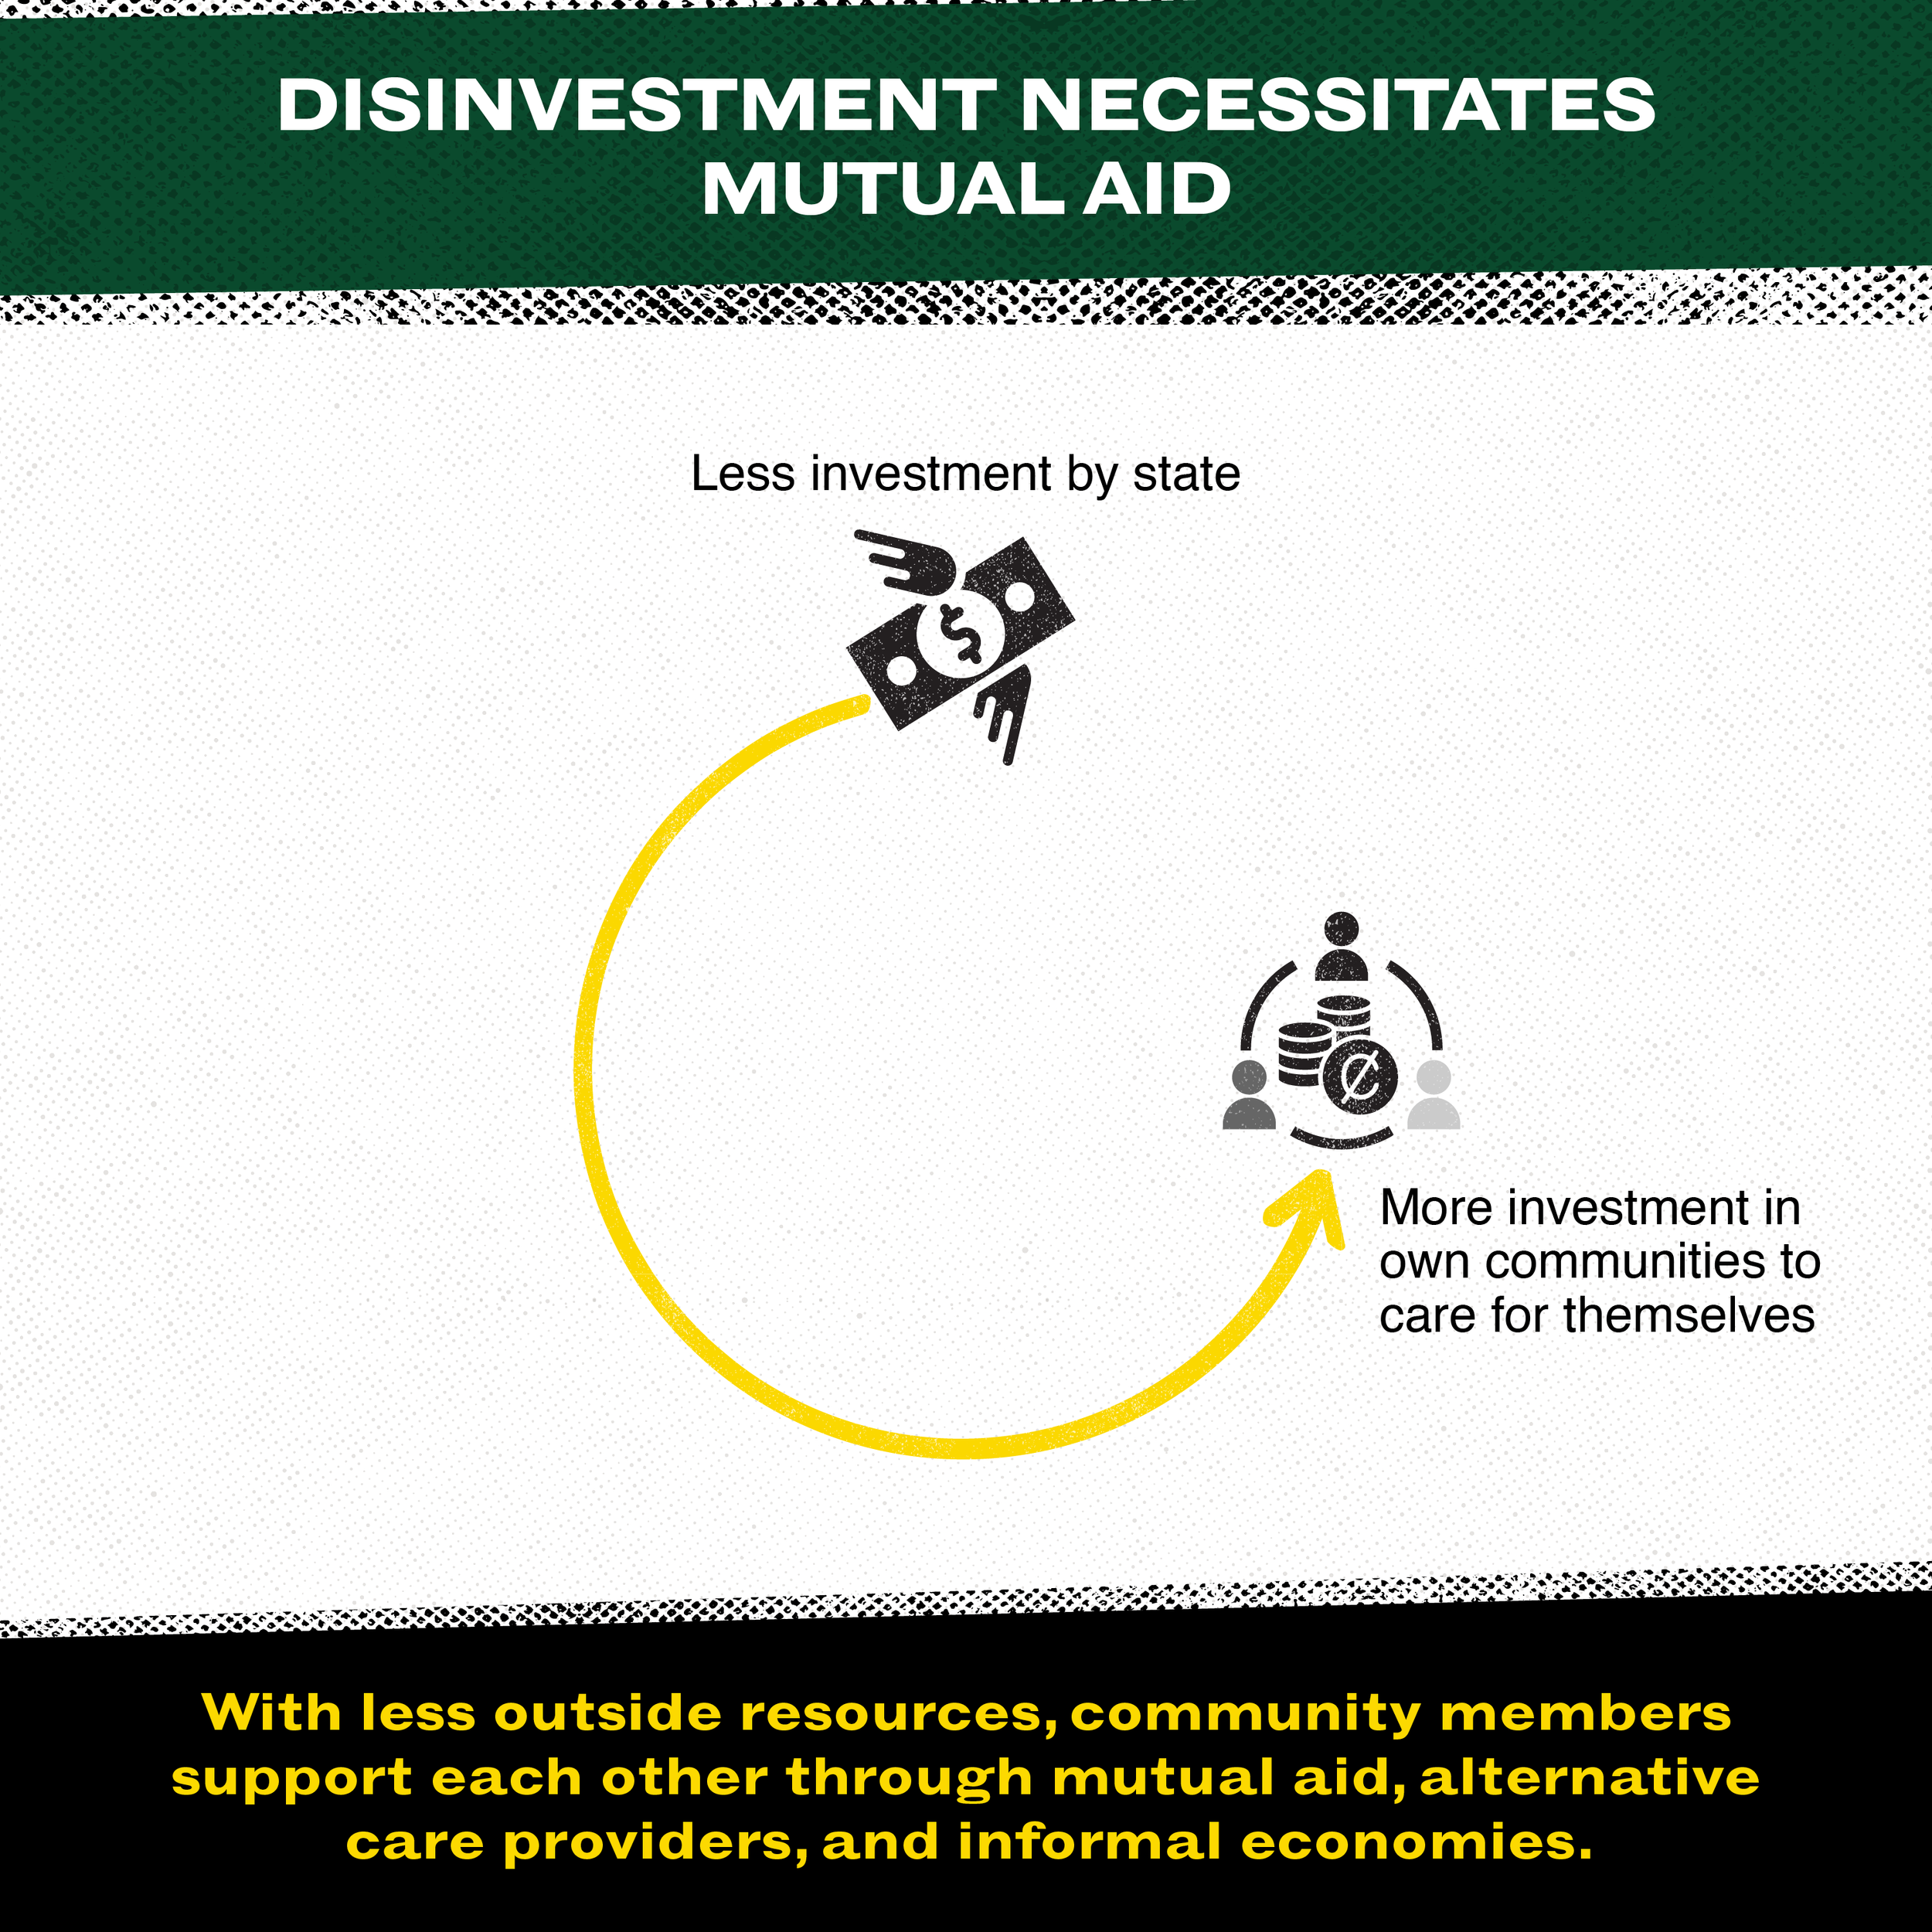
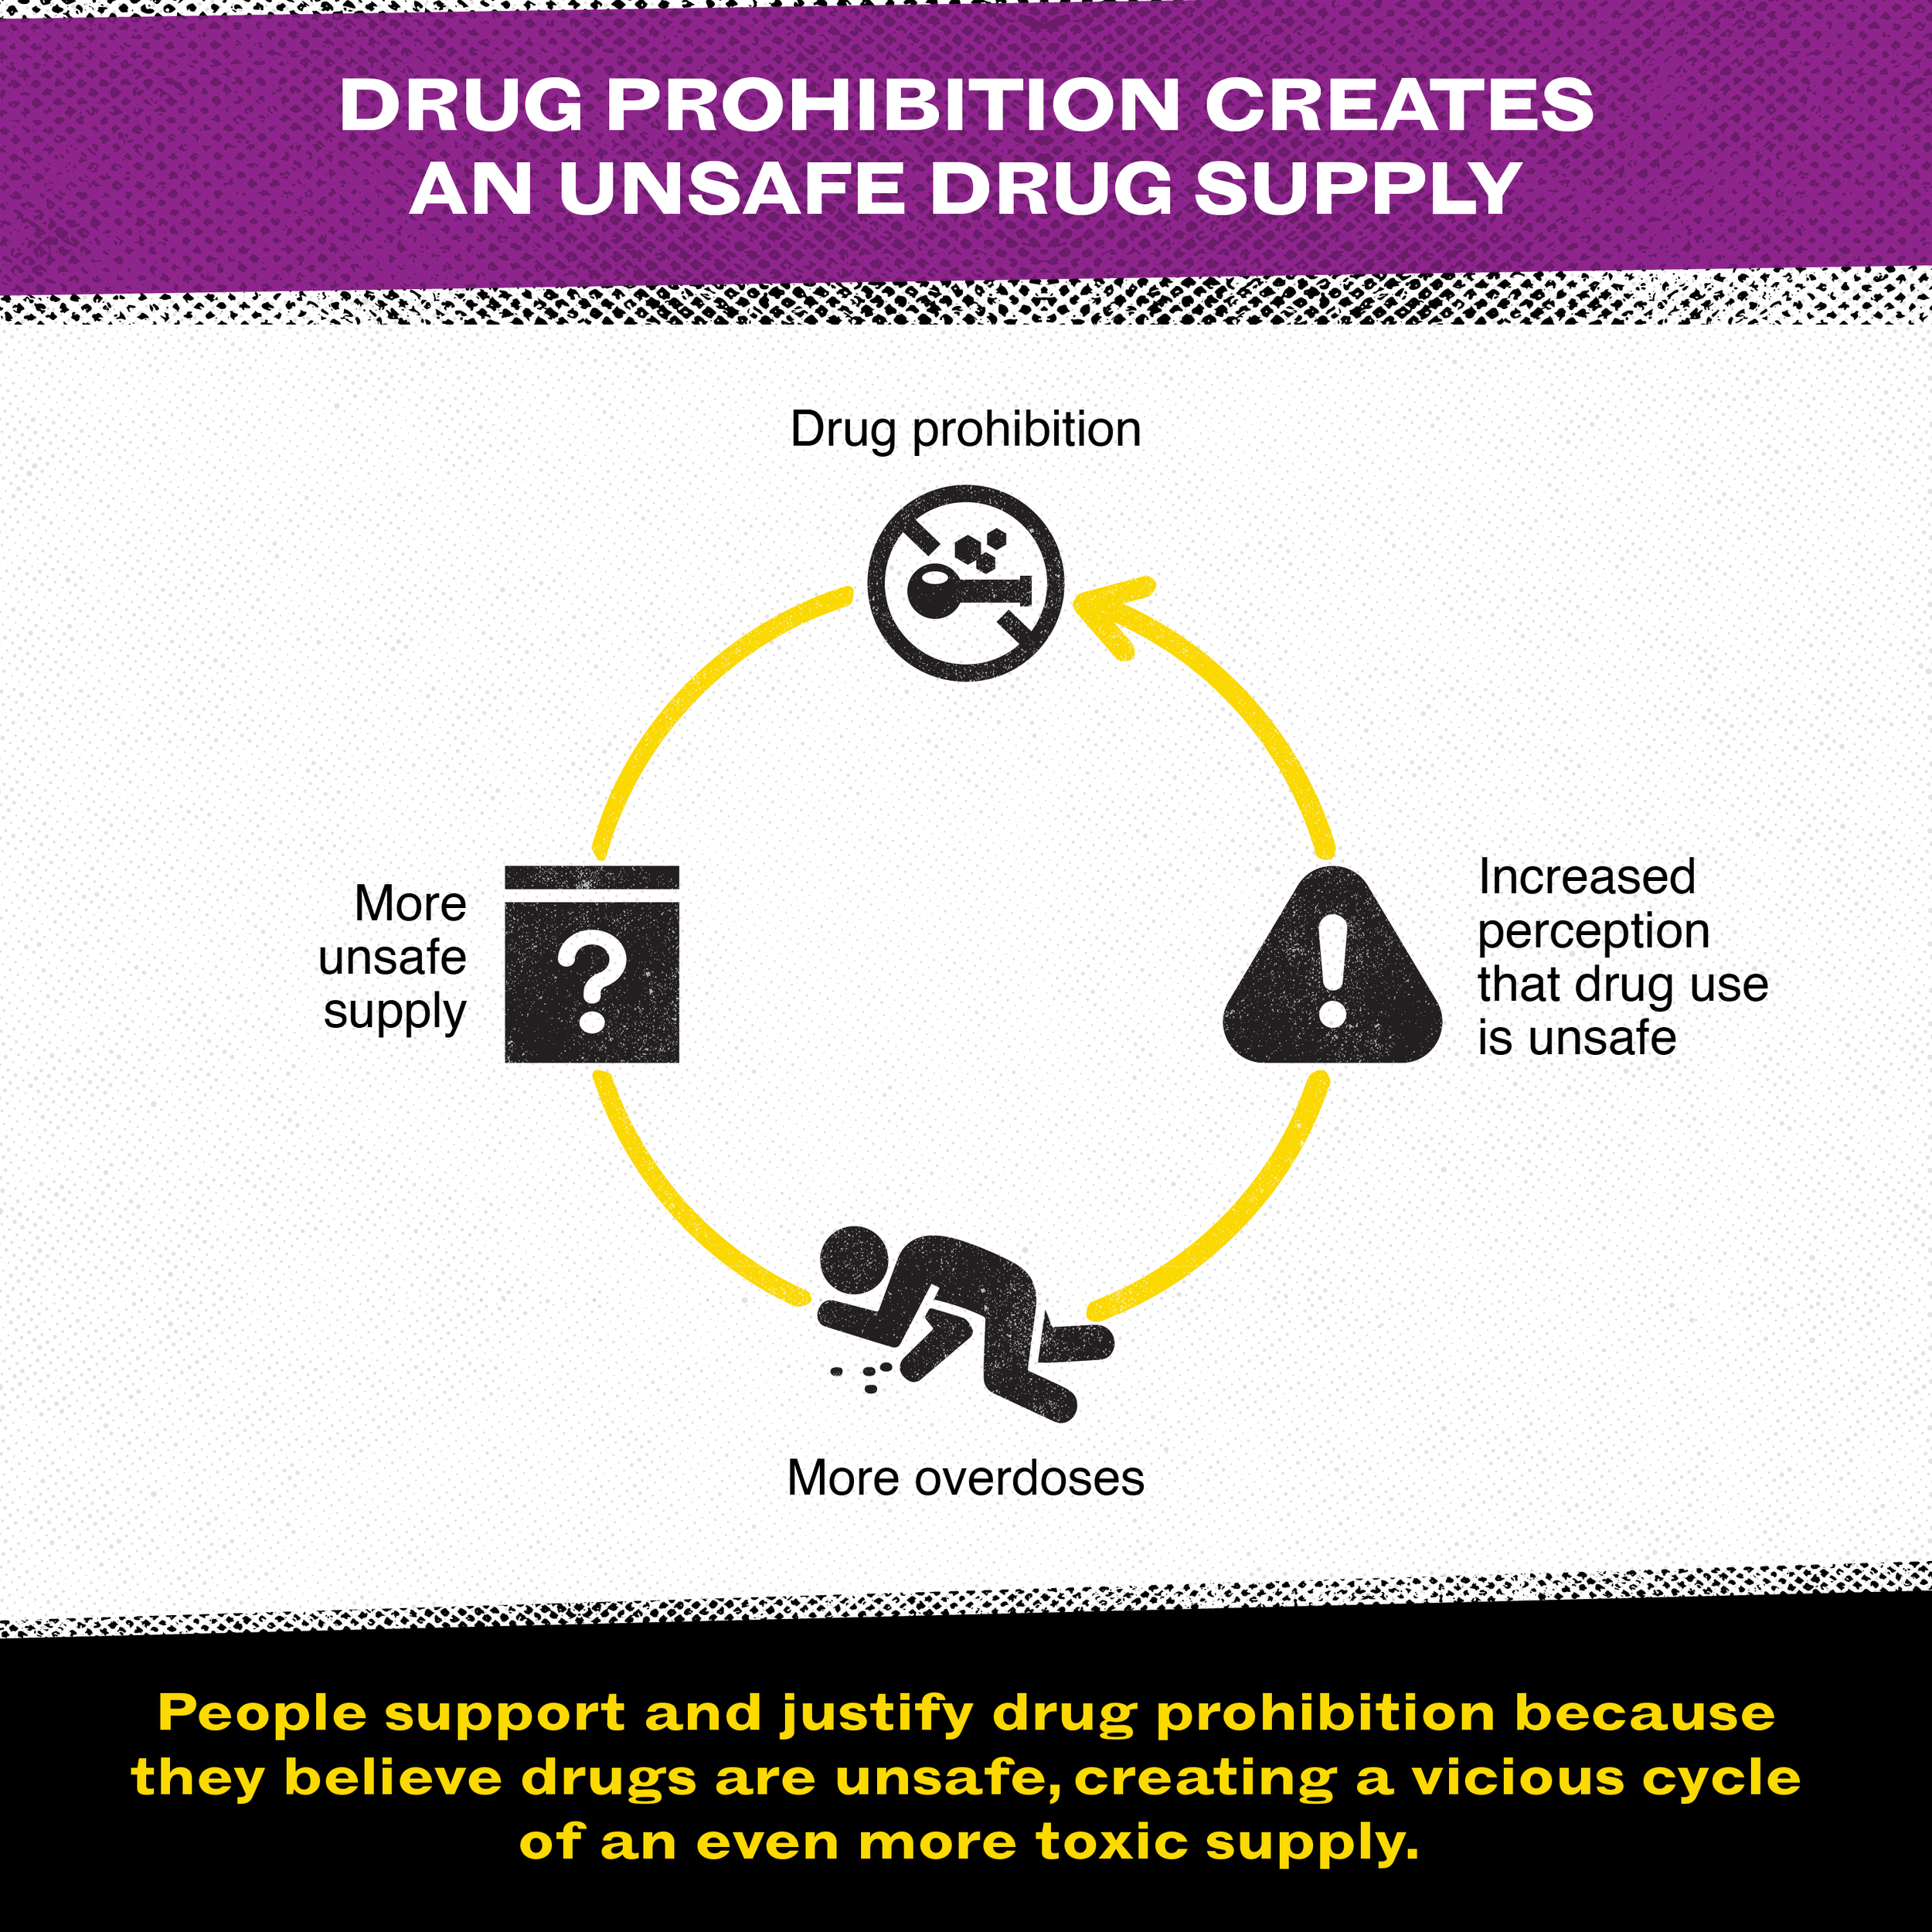
Extracted from a series of causal loop diagrams commissioned by the nonprofit Drug Policy Alliance, these illustrated cycles depict factors of public policies that entrench people who use drugs into the criminal legal system. Appearing on the DPA website and social media accounts, the illustrated cycles of harmful help sought to educate the general public as well as effect change in governmental drug policies.


One of the original causal loop cycles
Client: Drug Policy Alliance
My role: Information design, graphic design
Brief: The Drug Policy Alliance worked with statisticians to identify various policies that entrench people who use drugs into the criminal legal system. The findings were organized into a series of causal loop diagrams to depict the interplay of factors that create these cycles of harmful help. The resulting intricate diagrams were not immediately understandable by the general public or government policy makers and needed to be made both more engaging and explicit.
Challenge: Transform confusing causal loop diagrams into a series of visually engaging and understandable infographics to appear on the DPA website and social media accounts.
Solution: Collaborating with DPA stakeholders, the top priority goal was determined to be simplifying the visual complexity of select key cycles. I dissected the causal loop diagram into discrete cycles and created an icon system to illustrate the factors composing each cycle. The distressed look and feel of the illustrated cycles followed established DPA brand guidelines.
Result: Appearing on the DPA website, social media accounts, as well as print and presentation materials, the illustrated cycles of harmful help served to educate the general public and effect change in governmental drug policies.
Programs: Illustrator, Photoshop, InDesign